In last year’s advents calendar, we presented the Master theses of two students. One of the students, Stian Aleksander Helsem has successfully defended his thesis this year. I still remember the first time we met. He came into my office being interested in writing his Master thesis with me. He was not interested in doing a project in the lab or the field, but wanted to learn bioinformatics. We discussed differed possibilities and he decided that dating the annelid tree of life using molecular and fossil data was the way to go for him. The title of his thesis was “Divergence time estimates for several phylogenies of Annelida (Lophotrochozoa)”. As we plan to publish the results, I give you here only a sneak peak. More to come when it is out.
After he had finished his courses and could really start to work on the project, we already had to change our plans we wanted to conduct the analyses. Thanks to the WormNetII project, we had access to more than 300 transcriptomic datasets for Annelida. Moreover, in recent years the phylogeny has stabilized with only two major hypotheses being proposed in the moment, which are in major parts similar and deviate only in the position of a few families. He nonetheless based his analyses on both trees and used them as backbone trees for different analyses at the family level. The representative of each family were also chosen given different criteria such evolutionary rate or base composition. Thereby two different strategies were employed for choosing. One strategy was to generate composite so-called operational taxonomic units (OTUs), where for each family the gene of species with best value for the criterion was chosen. So the family representative could comprise the genes of several species. The other strategy was to choose the best species over all genes as the representative for the family. The next level of exploration was to apply two different methods of dating, RelTime and MCMCtree. Finally, he decided to use 18 different fossil calibration points across the annelid phylogeny as well as several calibration schemes for these fossils. These different layers of factors result in a total of 444 dating analyses.
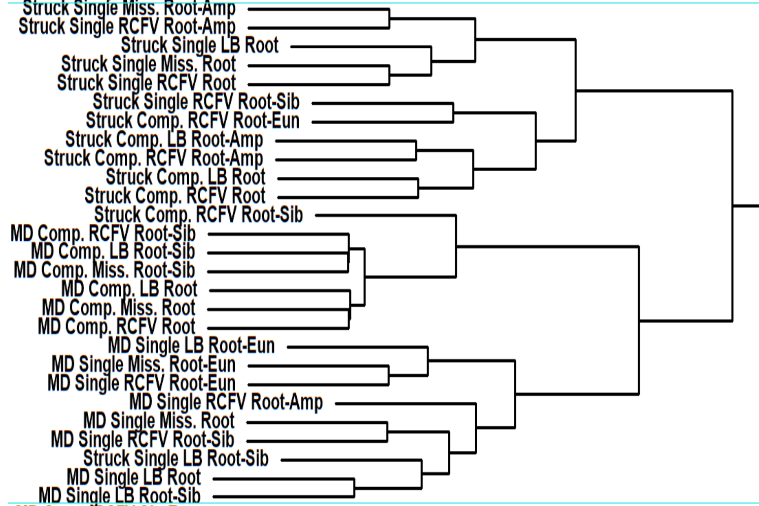
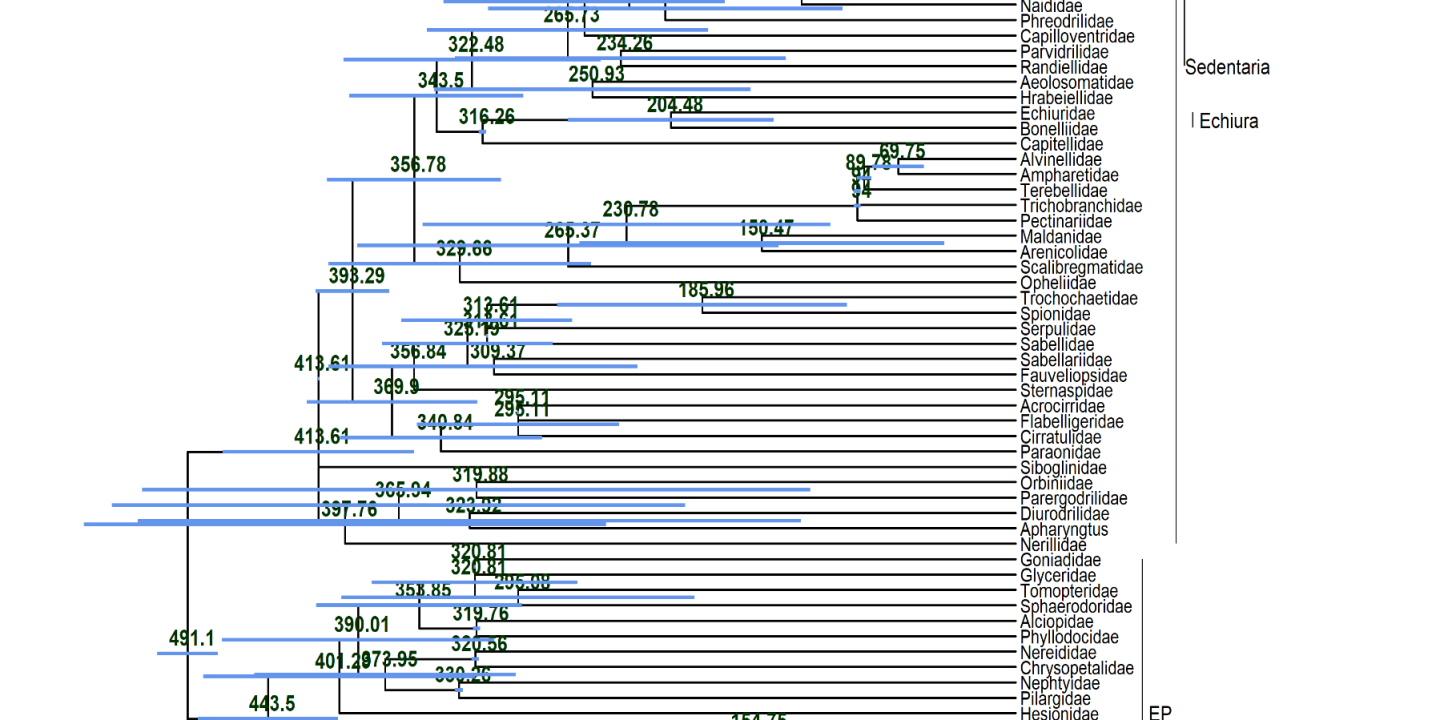
These large number of analyses allowed him to thoroughly and statistically analyze the impact of the different factors on the dating and not only to look at individual trees as shown in the featured image above. He did so concentrating on 12 nodes of interest across the annelid tree of life with a special emphasis on basal nodes. In these cases, the dating methods, the filtering of the data based on different criteria ot the actual backbone tree used had very little influence on the dating results. The biggest influential factor by far was the calibration scheme used for the dating (see the part of hierachical clustering results above). Especially, certain calibration points at the base were extremely influential on the dating.
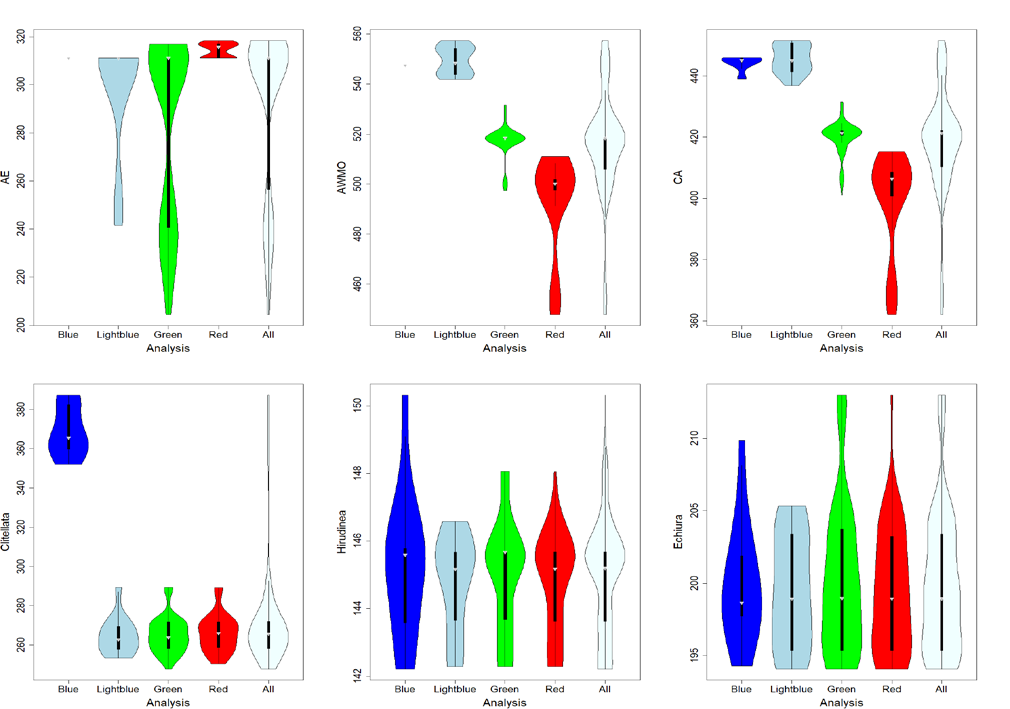
Using further detailed statistical analyses like the violin plots shown above Stian could show that there is a major disagreement between the the molecular branch length in certain parts of the annelid tree of life and the fossil record for certain groups. These disagreements make the dating of these nodes extremely challenging as they enforce extremely high, pulsed mutation rates along these branches. Stian discussed in his these the different possibilities, which could cause these extreme disagreements, and concluded that the most likely explanation for this is that a certain putative fossil was falsely assigned and should not be used for dating the annelid tree of life.
As his supervisor, I can only thank Stian once more for the effort he put into this. His dedication to the project and his learning curve in bioinformatics were tremendous. Conducting all of these analyses with very little bioinformatic background at the start and also getting into the statistical analyses in R was great to witness.
![]()